Wednesday, April 10, 2013

Exchange MP and PowerShell 2.0

Normally after you imported the Management Pack, once all the discoveries had completed, you will begin to see the health status begin to appear in the SCOM console, following by SCOM periodically executing the scripts defined within the MP to capture performance data and this includes the Exchange MP.

In a particular assignment, after the Exchange 2007 MP has been imported, servers with the Exchange roles are successfully discovered, but lacking on certain information and one of the them is the number of mailbox for each of the mailbox servers. At first i thought it might be due to MS is still collecting the data but after some time (or even days) the value is still not out yet.

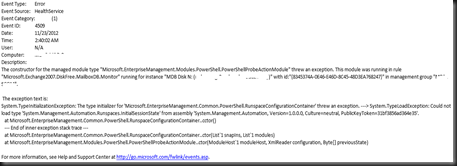
With the help from the SCOM guru and checking on the mailbox servers, only we found that there are quite a number of errors in the OperationsManager event log, with the following message.

image

Checked further from the net only to deduce that the servers hosting the Exchange roles (which is running on windows server 2003) needs to be installed with PowerShell 2.0. Fortunately there is a DR server which we can try to prove our point. Once PowerShell 2.0 was installed, things just started to work as expected. Winking smile

Monitoring Java EE Application Servers

We all know that with SCOM is fantastic in monitoring Microsoft roles and services with the relevant Management Packs, but what about those from non-windows platform ?

I had recently deployed a SCOM agent to monitor an Ubuntu server (and the Ubuntu server is hosted pretty much well in a Windows 2012 hostSmile) , and the server was installed with Apache Tomcat and MySQL.

We are able to monitor the service availability of Tomcat server via a simple service monitor, but what if we are required to perform a deeper monitoring in terms of the availability of the applications hosted and also the performance of the Tomcat ?

You can either purchase a third party MP or you can actually download the JAVA EE MP from the Microsoft website to do the same.

The JAVA EE management packs can be downloaded from the official website http://www.microsoft.com/en-us/download/details.aspx?id=29270, and for the first time users, it will be useful to go through the SC2012OM_JEE_Readme.txt included at the MP download page.

For a start, i am testing on Tomcat Apache 6.0 web server. During the MP is imported, things were not automatically discovered even after i had deployed the BeanSpy.

Next, what needs to be done is to copy the following powershell scripts and put it in a single folder, and run the NewJEEAppServer.ps1

JEEAppServerLibrary.ps1
NewJEEAppServer.ps1
RemoveJEEAppServer.ps1  (optional as i am not removing any server)

image

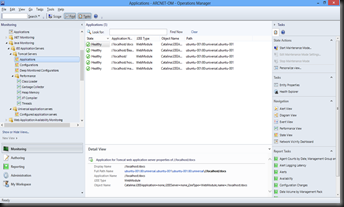
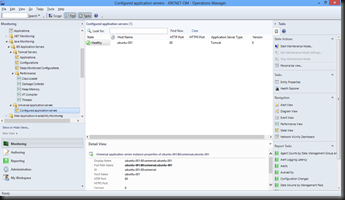
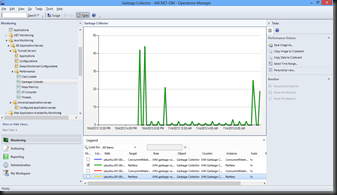
If everything goes smoothly, it should display you the response as above. and when discovery is done, some of the views (state and performance) are what you should be able to see.

image

image

image

SCOM Cross Platform monitoring

Based on one of my SCOM assignments which requires Ubuntu to be monitored, we all know that with the previous SCOM 2012, this might not possible (well, we can still use SNMP to monitor whether the server is up or down, but nothing further than that i guess)

With the release of System Center SP1, which monitoring of the version and variants of cross platform OS has been extended, i am quite eager to see how this is possible.

What i have in the lab is a virtual Ubuntu 12.04 server hosted in a Windows Server 2012 server, with apache Tomcat and MySQL services installed. First is to install the SCOM Agent and to make things easier, i have been using root account for the agent installation.

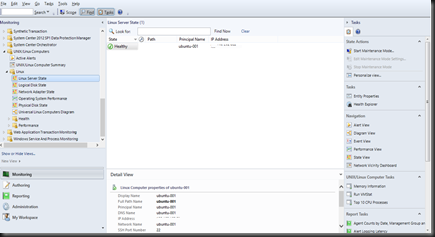
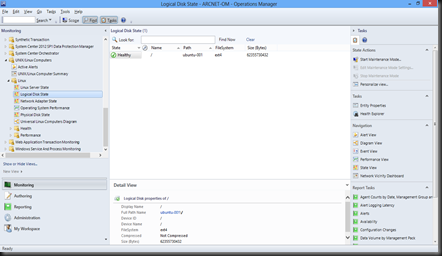
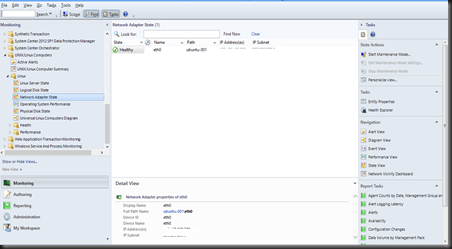
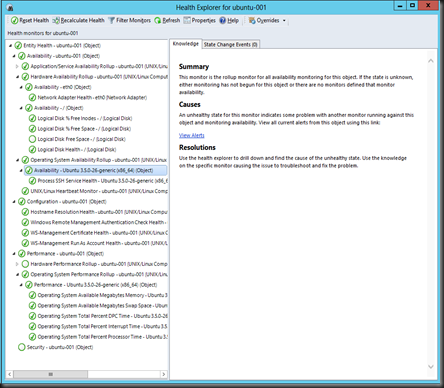
Some of the screen from the monitoring are as below.

image

imageimageimage

Stay tuned to my upcoming posts on monitoring Apache Tomcat Web Server via Microsoft JEE Application Server MP.